Charts and diagrams
Give detailed images a description everyone can read.
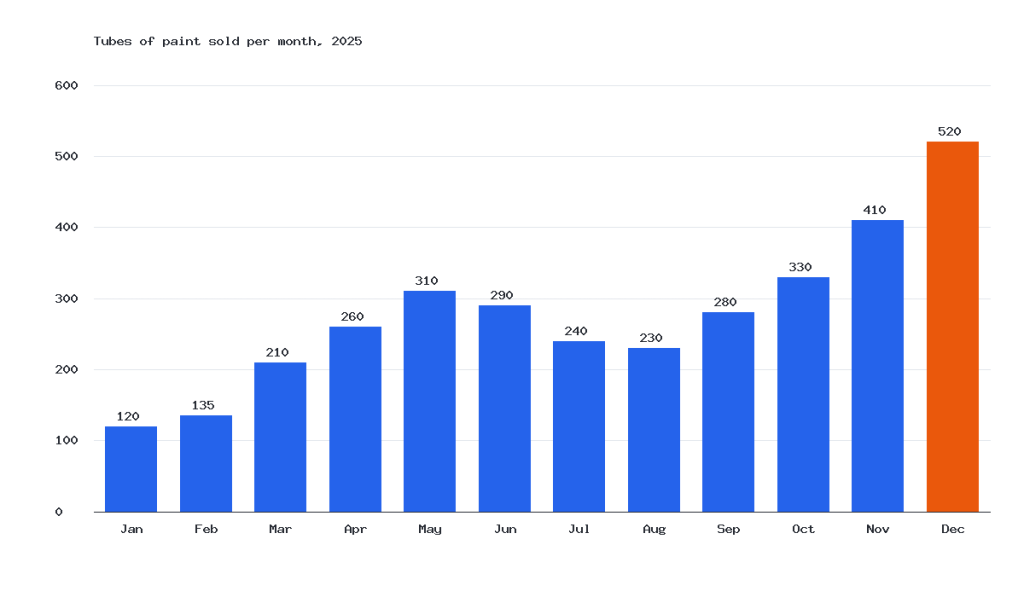
Each example below is the actual published output of the Image with long description widget with a sample bar chart of monthly paint sales. Open the description to read the chart as text.
Long description
Sales grew through the year, with two dips.
- January 120, February 135, March 210, April 260, May 310.
- June 290, July 240 and August 230: a summer dip.
- September 280, October 330, November 410.
- December 520, the highest month, driven by gift sets.
Full figures are in the 2025 sales spreadsheet.
Default settings: the chart at full width, its short alt text, and a Long description label that opens the full description.